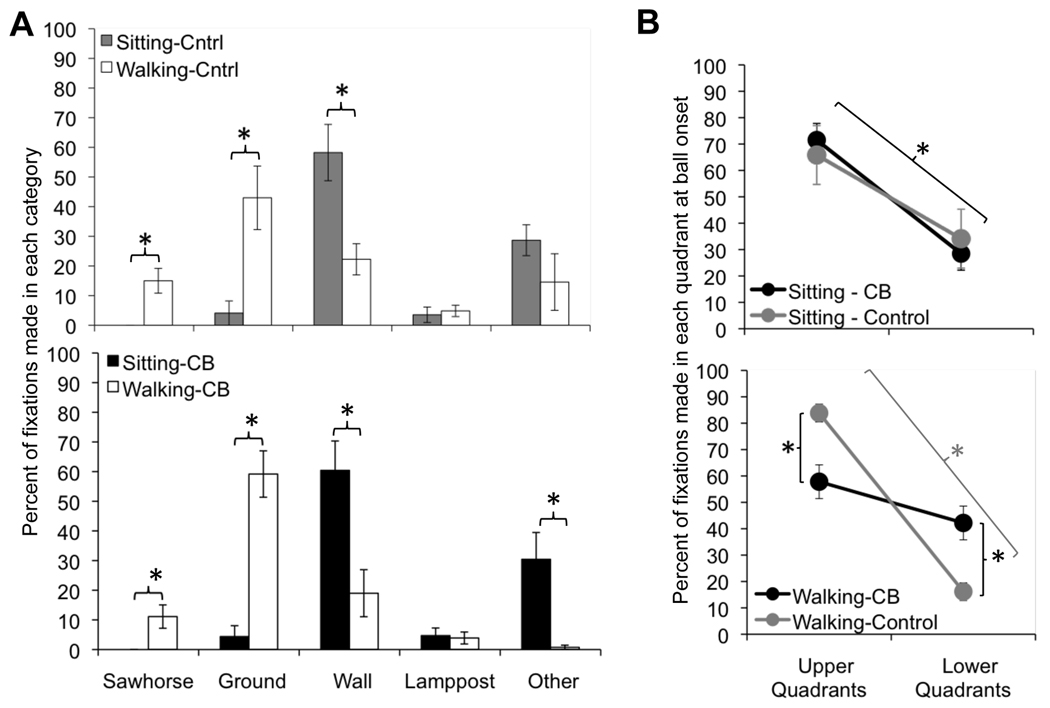
Figure 7. Effect of vision loss on fixation category parameters.
A. Percent of fixations made in each category over the duration of the sitting and walking tasks, separated into fixations made by controls and cortically blind (CB) subjects. B. Percent of fixations placed into the upper or lower quadrants of the visual field, as a function of subject group, across the sitting and walking conditions. Error bars = SEM, * = p<0.05.

