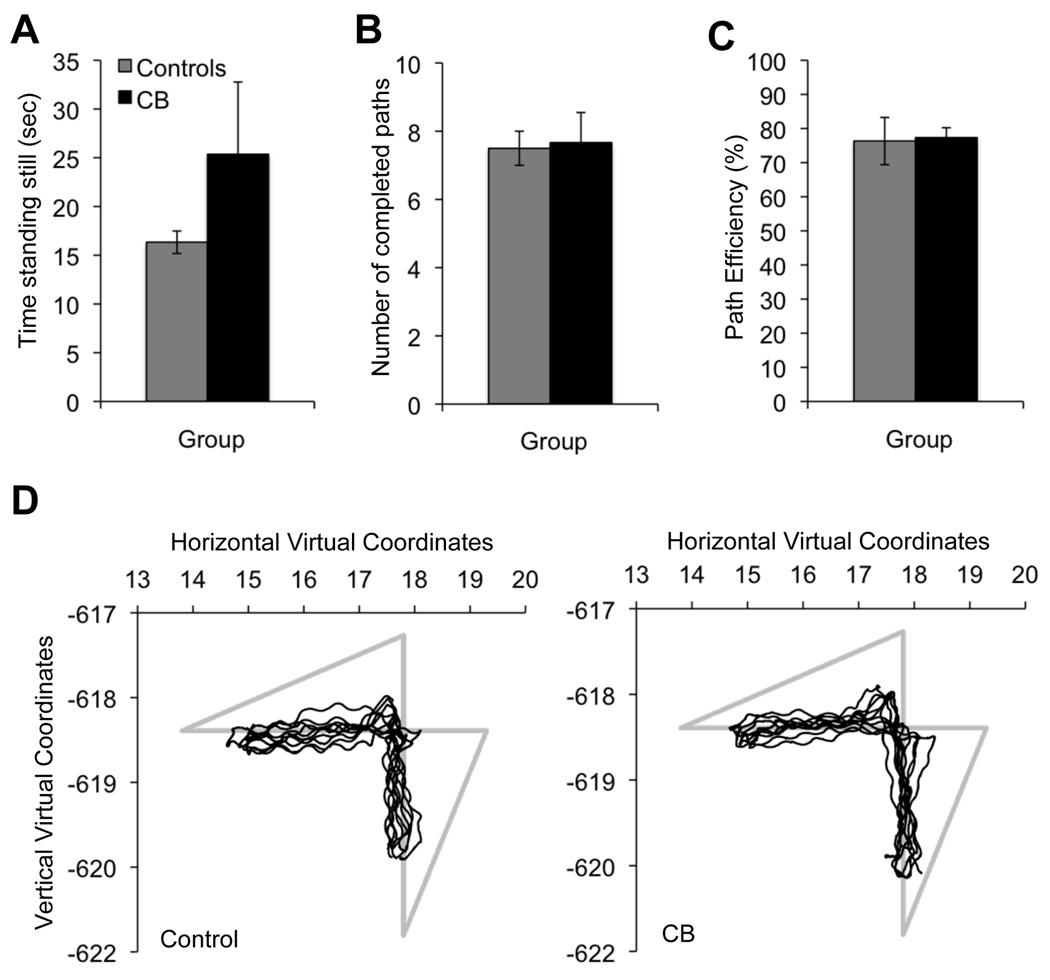
Figure 8. Effect of vision loss on walking parameters.
A. Time spent standing still during the entire duration of the walking task. B. Number of completed circuits during the walking task. C. Path efficiency as a function of maximal distance between sawhorses. D. Schematic representation of the first 5 paths walked by a control and a cortically blind (CB) subject. The light gray lines denote ideal path measured from sawhorse center to center. The thin black lines denote the actual path walked by each subject. Note the slight waviness, likely due to body sway, and the high degree of similarity between the control and the cortically blind subject's performance.

