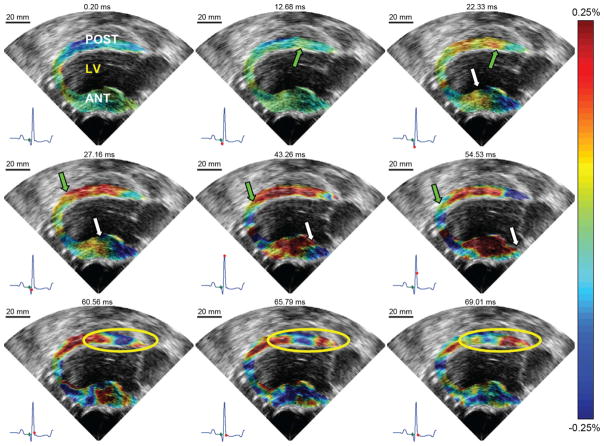
Fig. 5.
EWI of the normal heart under sinus rhythm using incremental strains in the parasternal two-chamber view. LV, ANT, and POST, respectively, denote left ventricle cavity, anterior wall, and posterior wall. Top row: Approximately 12 ms after the onset of the QRS, excitation of the posterior wall endocardium begins. It then propagates both towards the base and the apex. A few milliseconds later, the anterior wall begins to thicken. Middle row: 45 ms after the onset of the QRS, the myocardium is almost completely mechanically activated; thinning of portions of the base are still visible. Bottom row: After the mitral valve closes, an oscillating wave (yellow circle), different in nature from the EMW, is observed. It emanates from the base and travels towards the apex.

