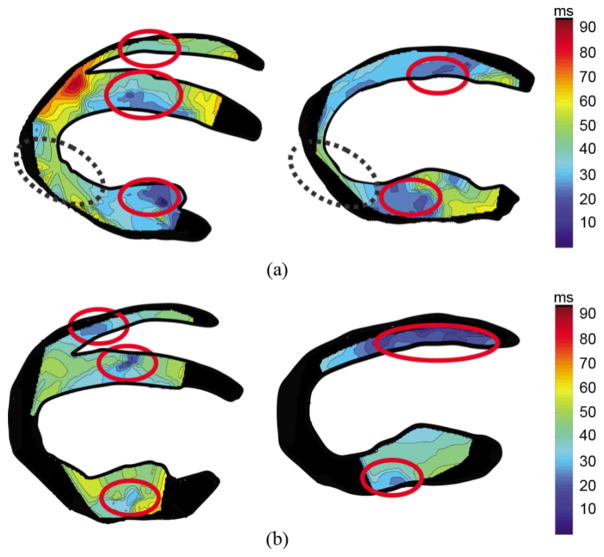
Fig. 6.
Isochrones in two different canine hearts (a), (b) in the four-chamber (left panel) and two-chamber (right panel) views showing the time of arrival of the EMW. Early activated zones are depicted in dark blue, in 10 ms increments. Despite the fact that the two propagation patterns are not identical, they show similar regions of early depolarization and a propagation emanating from those regions to apex and base. The dashed circles indicate the regions where the activation time correspond to shortening rather than thickening. Regions of the myocardium for which a clear zero-crossing point could not be obtained were depicted in black.

