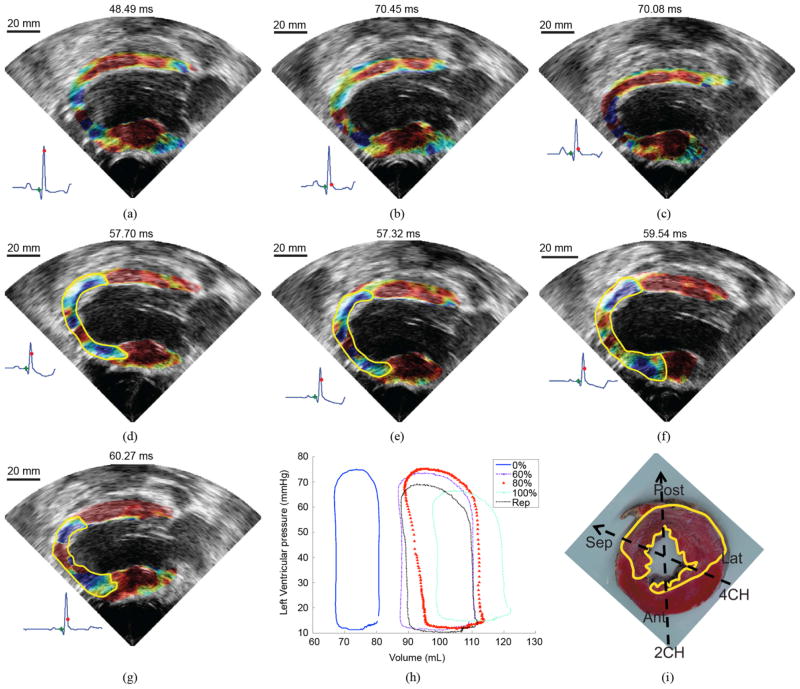
Fig. 7.
Evolution of the EMW as the occlusion level of the LAD is increasing. The time point chosen to display the EMW corresponds to the time at which the largest portion of the myocardium is activated. No significant differences were observed between (a) no occlusion and (b) 20% and (c) 40% occlusion. The ischemic region (delimited by the yellow line) becomes visible at (d) 60% occlusion and increases in size as the level of occlusion reaches (e) 80% and (f) 100%. (g) After reperfusion, the ischemic region was smaller. (h) Evolution of the PV loop with the occlusion level. (i) TTC staining after infarction (reperfusion). This mid-apical slice shows the extent of the infarcted region (white) over the viable tissue (red). The parasternal two- and four-chamber views are also depicted.

