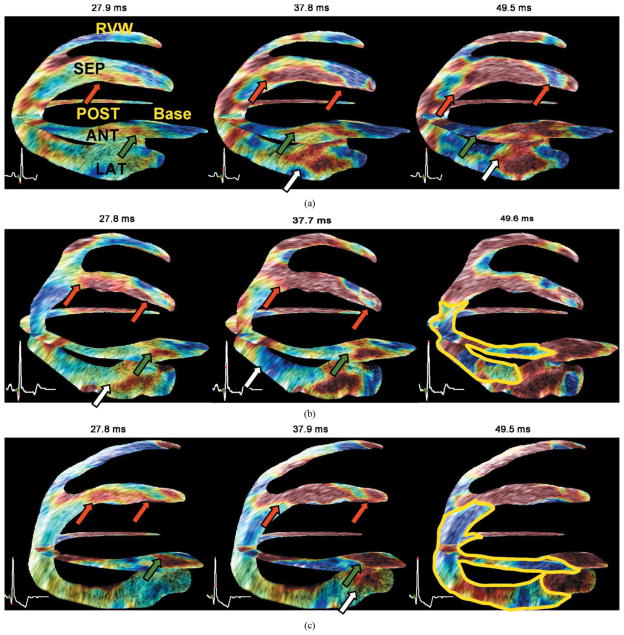
Fig. 8.
Bi-plane (two-chamber and four-chamber views) view of the same heart under different LAD coronary artery occlusion levels. Red, white, and green arrows indicate the propagation of the EMW in the septal, anterior, and lateral wall, respectively. (a) Without any occlusion, i.e., normal coronary flow, radial thinning is visible up to regions where the axial direction of the ultrasound beam coincides with the longitudinal direction of the cardiac geometry, where shortening is expected (in blue). (b) At 60% occlusion, this behavior is reversed in presence of ischemia: a region (delimited with a yellow line) containing radial thinning (blue) and longitudinal lengthening (red) is observed. (c) At complete occlusion this region increases in size. The ischemia is visible in the anterior, posterior and lateral wall near the apex at 60% occlusion and in the anterior, posterior, lateral, and septal wall at 100% occlusion.

