
FIGURE 3:
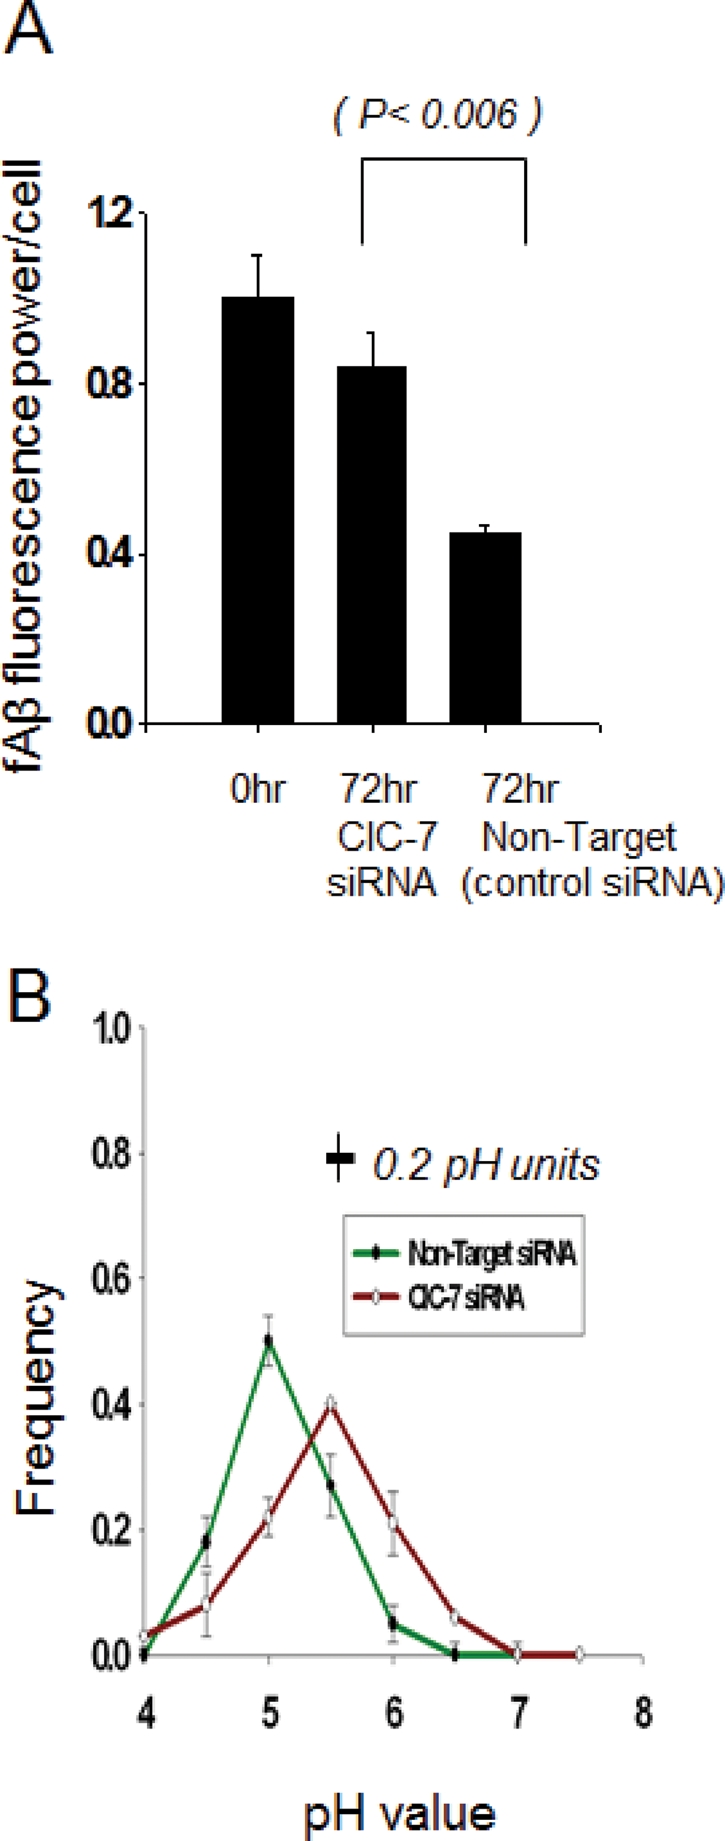
Degradation of Cy3fAβ and lysosomal acidification in MCSF I–treated primary mouse microglia after ClC-7 knockdown. (A) Degradation of Cy3fAβ by MCSF I–treated primary microglia after control and ClC-7 siRNA treatment. Cy3 fluorescence retained inside the cells 72 h after a 1-h uptake of Cy3fAβ. Error bars represent SEM, and p values are obtained using Student's t test (two tailed). (B) Frequency distribution of lysosomal pH in MCSF I–treated primary microglial cells treated with nontarget control siRNA (green) or siRNA against ClC-7 (orange). The values plotted are the fraction of lysosomes with pH values in the interval within ±0.25 pH units of the indicated value (e.g., 4.75–5.25 for pH 5.0). Error bars represent the SEM. The horizontal bar on the figure shows the SD for the measurement of pH values of individual lysosomes in cells fixed at pH 5.5. We analyzed the distribution of fluorescein/rhodamine fluorescence ratio values in (fluorescein-rhodamine)-dextran-loaded lysosomes to test for significance in the differences in the pH distributions. The distributions differed significantly (p < 0.001).