FIGURE 7:
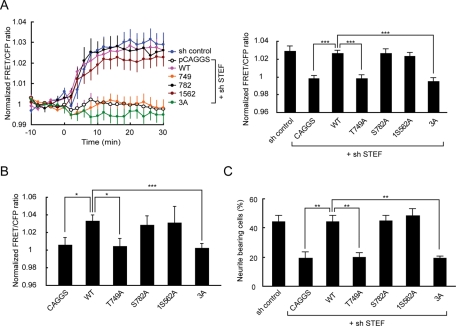
Identification of a critical PKA phosphorylation site on STEF for dbcAMP-induced Rac1 activation and neurite outgrowth. (A) PC12D cells were transfected with pCAGGS-3HA-resi-STEF-WT or its mutants in combination with pSUPER-STEF. After selection with puromycin, the cells were further transfected with pRaichu-Rac1. After starvation for 2 h, images were obtained every 2 min for 30 min after dbcAMP treatment. Left, time-course of the mean FRET/CFP ratios averaged over the whole cell. The number of experiments was as follows: control (n = 18), pCAGGS (n = 28), WT (n = 33), Thr-749A (n = 36), Ser-782A (n = 19), Ser-1562A (n = 18), 3A (n = 17). Error bars show the SE. Right, the bar graph represents the average of the highest values of Rac1 activation in the indicated samples, with SE. The symbols indicate the results of a Student's t test (***p < 0.001). (B) COS-7 cells were transfected with pCAGGS-3HA-resi-STEF-WT or its mutants in combination with pRaichu-Rac1. After starvation for 2 h, images were obtained every 2 min for 30 min after dbcAMP treatment. The bar graph represents the average of the highest values of the normalized FRET/CFP ratios during the 30 min in the indicated samples, with SE. The number of experiments was as follows: pCAGGS (n = 30), WT (n = 49), Thr-749A (n = 15), Ser-782A (n = 9), Ser-1562A (n = 16), 3A (n = 13). The symbols indicate the results of a Student's t test (*p < 0.05, ***p < 0.001). (C) PC12D cells were transfected with pCAGGS-3HA-resi-STEF-WT or its mutants in combination with pSUPER-STEF. After recovery, the cells were incubated with puromycin for 2 d, and then fixed for microscopy. Cells with neurites the lengths of which were at least twofold longer than their cell body lengths were scored as neurite-bearing cells. At least 50 cells were assessed in each experiment, and the experiments were repeated three times. The results are expressed as the mean percentage of neurite-bearing cells, with SE. The symbols indicate the results of a Student's t test (**p < 0.01).

