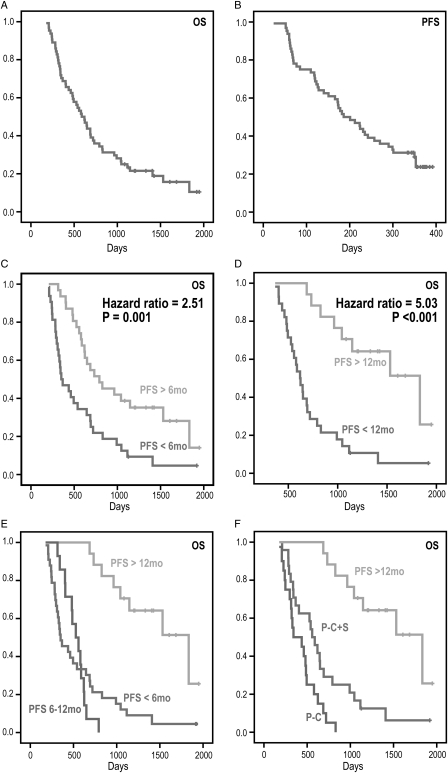
Fig. 3.
Kaplan–Meier survival curves for OS and PFS. The median OS (A) was 588 days, and median PFS (B) was 186 days. Survival curves (C) and (D) are for populations split based upon whether the patient progressed or was stable by 6 months and 12 months. Patients who progressed within 6 months or 12 months had shorter survival; but there was no significant difference between patients who progressed by 6 months and patients who progressed between 6 and 12 months (E). Patients who progressed within a year benefited from the combination of reoperation and chemotherapy (P-C + S) (F).

