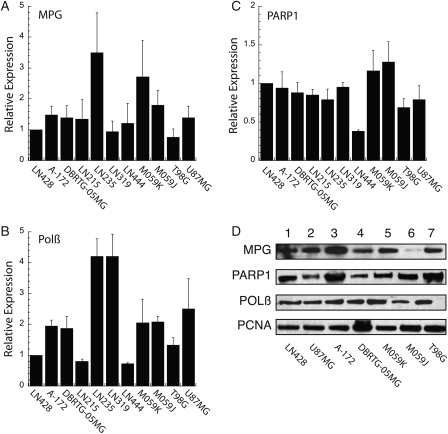
Fig. 5.
Expression profile of MPG, PARP1, and Polβ in established glioma cell lines. (A–C) The relative expression of mRNA for (A) MPG, (B) Polβ, and (C) PARP1 in GBM cell lines, as indicated in the figure, was measured by quantitative RT-PCR using an Applied Biosystems StepOnePlus system, as described in the Materials and Methods, normalizing to the LN428 cell line across samples. Analysis of mRNA expression was conducted as per the manufacturer (▵▵CT method) and normalized within each sample to the expression of human β-actin (part #4333762T). (D) MPG, Polβ, and PARP1 expression, as determined by immunoblot analysis of nuclear protein extracted from the indicated cells. PCNA expression is shown as a loading control.

