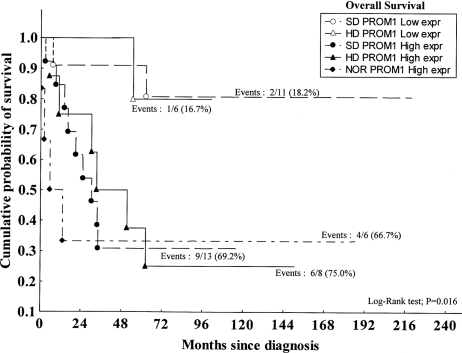
Fig. 3.
Kaplan–Meir survival plot showing prognostic significance of PROM1 expression pattern (≤1.32 [low expr] vs >1.32 [high expr]) and patient treatments (NOR, HD, and SD). To perform the statistical test (ie, the log-rank test), the group NOR/low PROM1 expression was excluded, because it was represent by only 1 patient. That patient is still alive after a follow-up of 13.6 years.

