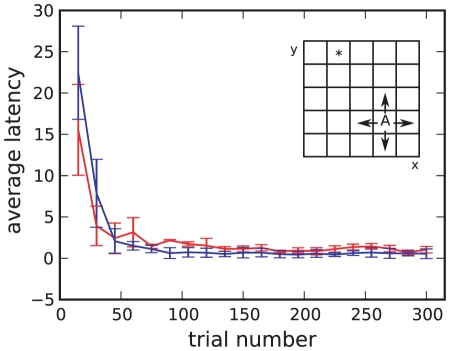
Figure 7. The grid-world task.
Average latency in reaching the reward state and standard deviations over  runs for the neuronal network model with optimized parameters
  ,
,  ,
,  and reward
  (red curve) and the corresponding classical discrete-time algorithmic TD
 implementation with
  ,
,  ,
,  and reward
  (blue curve). Each data point shows the average latency over
  successive trials. Inset: grid-world environment consisting of
  states. Only the state marked with an asterisk is rewarded. In each state the agent (A) can choose between
  directions (indicated by the arrows). Once the rewarded state has been found, the agent is moved randomly to a new starting position.

