
Figure 6. Electron microscopy of N-RNA complexes.
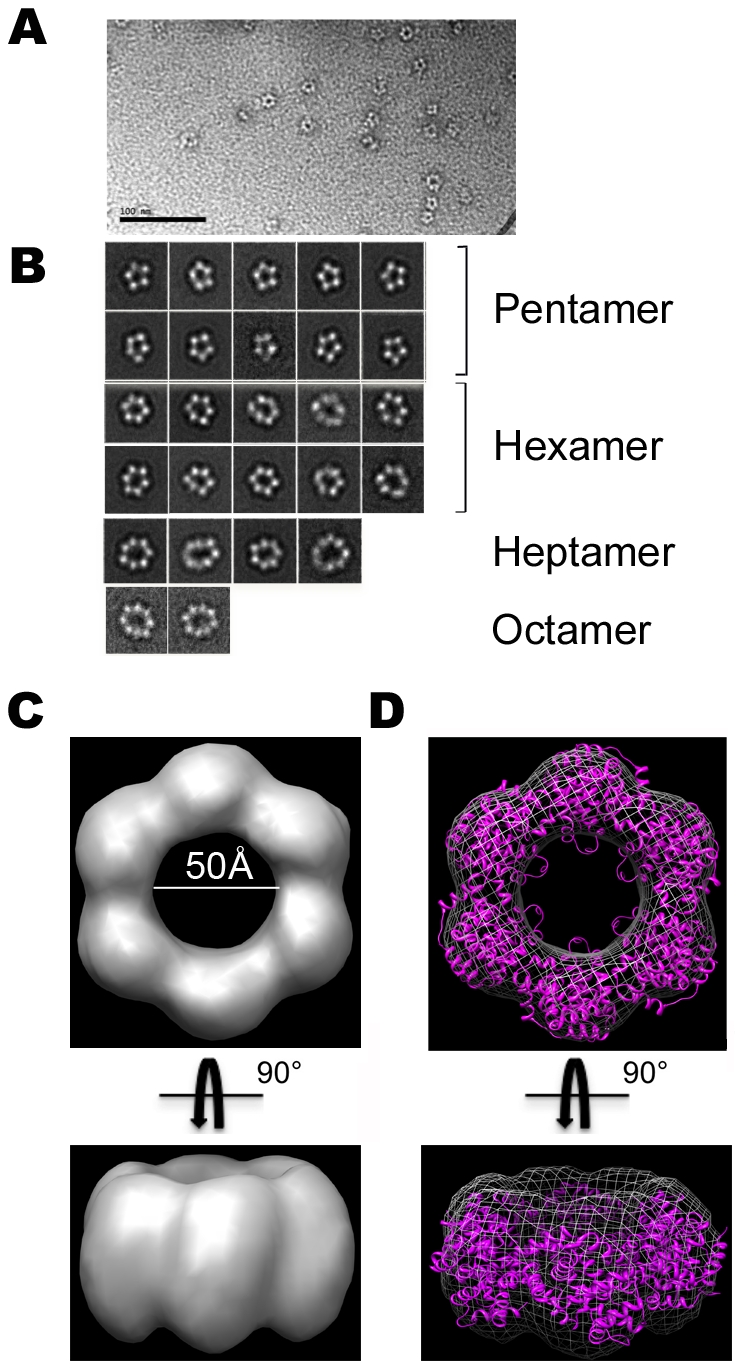
(A) Representative electron micrograph of the N1 fraction in negative stain, revealing ring-shaped particles of different sizes. Scale bar is 100 nm. (B) Representative class averages of N-RNA rings. (C) 3D reconstruction of a hexameric N-RNA complex obtained with cryo-negatively stained samples. (D) Docking of the crystal structure of hexamer I formed by native N into the EM density map of the hexameric N-RNA complex.