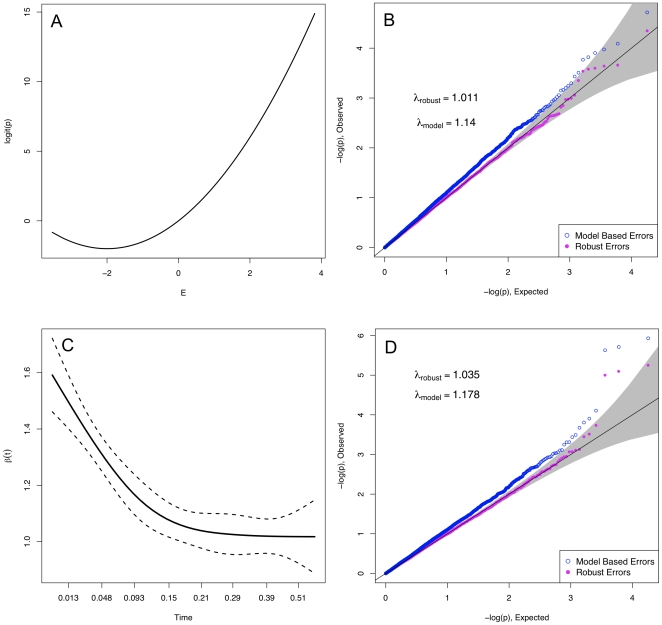
Figure 4. Example of behavior in logistic and proportional hazards regression.
The top row displays the results for logistic regression, and the bottom for proportional hazards. The data was simulated according to  and
and  with half of the data censored at the median survival time. The top left shows the log odds of an event, which demonstrates non-linearity that was not specified in the model. The plot on the lower left displays a loess curve through the Schoenfeld residuals from the regression of Y on E. A non-zero slope is indicative of violation of the proportional hazards assumption.

