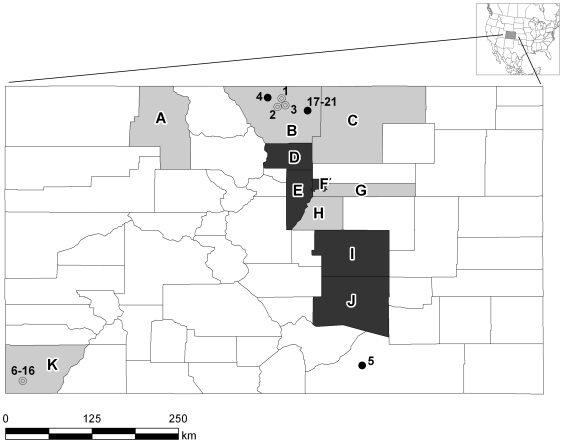
Figure 1. Map of Colorado showing sites where bats were sampled for the presence of CoV RNA.
Circles (#1–21) represent sites where live bats were captured and fecal or swab samples were taken; closed circles represent sites where bats tested positive for CoV RNA and open circles are those from which all samples tested negative. Shaded counties (A–K) were those from which intestines of bats submitted to public health departments were sampled for CoV RNA. Counties from which intestinal samples were negative for CoV are shown in gray and counties with at least one CoV-positive intestinal sample are shown in black.

