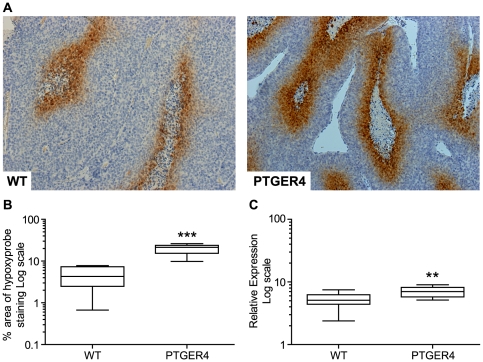
Figure 5. PTGER4 xenograft tumours display increased areas of hypoxia compared with WT control.
Immunohistochemistry for detection of hypoxia in WT (n = 5 sections) and PTGER4 (n = 5 sections) xenograft tumours as determined by staining for the Hypoxyprobe pimonidazole. (B) Quantitative stereology of hypoxia in WT and PTGER4 xenograft tumours as determined by percentage area stained positive for Hypoxyprobe. (C) mRNA expression of the hypoxia inducible factor HIF1α in WT (n = 10) and PTGER4 (n = 10) xenograft tumours. **, *** represents significance at P<0.01 and P<0.001 for PTGER4 versus WT respectively.

