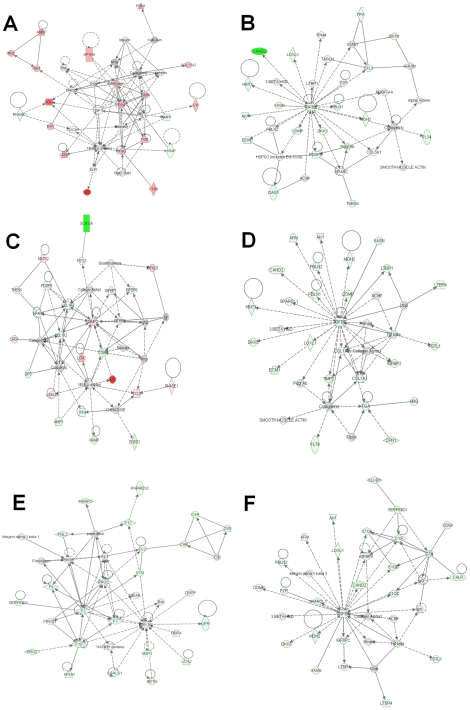
Figure 5. Network analysis of plasma proteins from confounding conditions.
Top networks assigned by Ingenuity Pathway Analysis for both increased and decreased proteins from the subacute inflammation (A, B), chronic inflammation (C, D) and angiogenesis models (E, F). Networks for the subacute model show abundant fibrinogen and ECM proteins, the chronic model gives prominent growth factor and collagen networks, while the angiogenesis network shows chemokine and coagulation proteins. [red = increased, green = decreased, white = no change in abundance in cases vs control mice, >1.25 fold p<0.05.].

