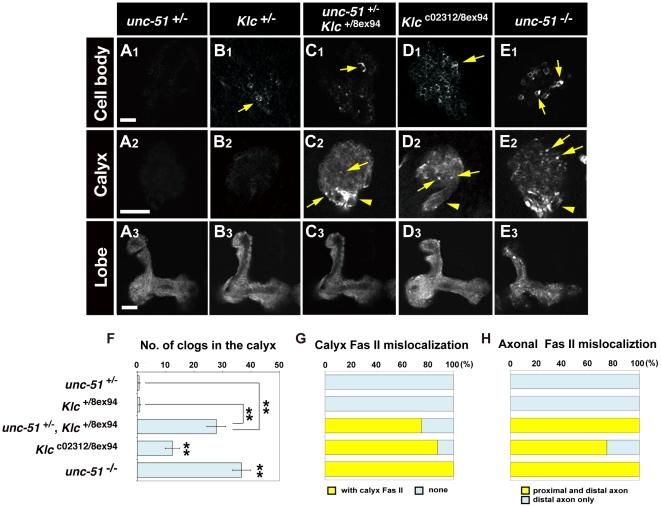
Figure 8. Aberrant Fas II accumulation and mislocalization in unc-51 and Klc mutants.
(A–E) Fas II::YFP distribution patterns in the cell bodies (A1–E1), calyx (A2–E2) and lobes (A3–E3). Fas II::YFP was expressed in MBs using the 201Y-GAL4 driver. Yellow arrows indicate aberrant Fas II clogs. Arrowheads (C2, D2 and E2) indicate Fas II mislocalization in the proximal peduncle. Scale bars, 10 µm. (F) Number of clogs in the calyx. Error bars, mean ± SEM. **P<0.01, Student's t test. Comparisons were also made between Klc c02312/8e×94 and Klc +/8e×94 (**P<0.01) as well as between unc-51 25/25 and unc-51 +/25 (**P<0.01). (G) Quantification of Fas II::YFP mislocalization in the calyx. (H) Quantification of Fas II mislocalization in the proximal peduncle. Sample sizes: unc-51 +/25 (n = 6), Klc +/8e×94 (n = 14), unc-51 +/25 Klc +/8e×94 (n = 4), Klc c02312/8e×94 (n = 8) and unc-51 25/25 (n = 8).

