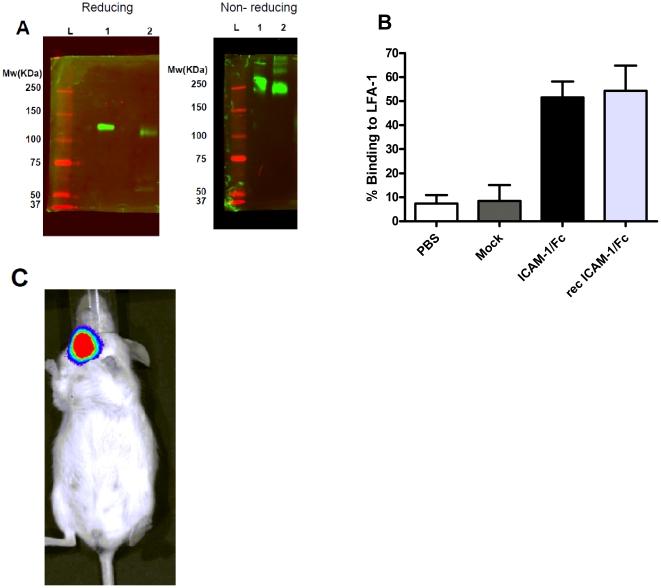
Figure 2. In vitro and in vivo expression and biological activity of ICAM-1/Fc.
A) In vitro expression of ICAM-1/Fc was shown using a reducing and nonreducing SDS-PAGE gel. Under reducing conditions, ICAM-1/Fc migrated as a monomer with a molecular mass of approximately 120 kDa and under nonreducing conditions as a dimer with a molecular mass of approximately 240 kDa. Lane 1 is recombinant ICAM-1/Fc and lane 2 is ICAM-1/Fc-transfected supernatant. B) The biological activity of the ICAM-1/Fc was determined by adding stimulated and labeled T cell blastoma cells to plates coated with ICAM-1/Fc-transfected supernatant. The optical density between before and after washing the wells is expressed as percentage binding to LFA-1. Data shown are mean values +/− SD of 3 experiments. PBS = phosphate buffered saline coated wells, mock = mock-transfected supernatant coated cells. C) In vivo imaging of luciferase expression within the SGs. One representative mouse is shown.

