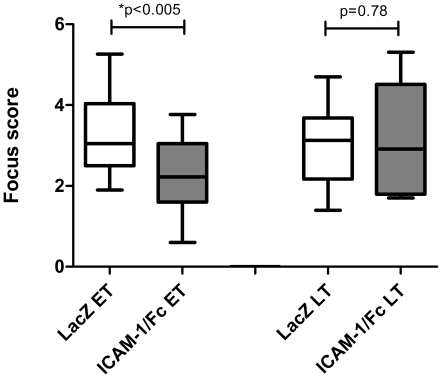
Figure 3. Decreased focus score in early treated mice.
SGs from early treated mice (N = 16 for LacZ and N = 19 for ICAM-1/Fc) and late treated mice (N = 8 for LacZ and N = 9 for ICAM-1/Fc) were removed for histologic analysis to assess the overall inflammation. Data are shown as box and whisker plots with the mean and 5–95 percentile. The P-value was determined by the parametric Student's t-test. ET = early treatment, LT = late treatment.

