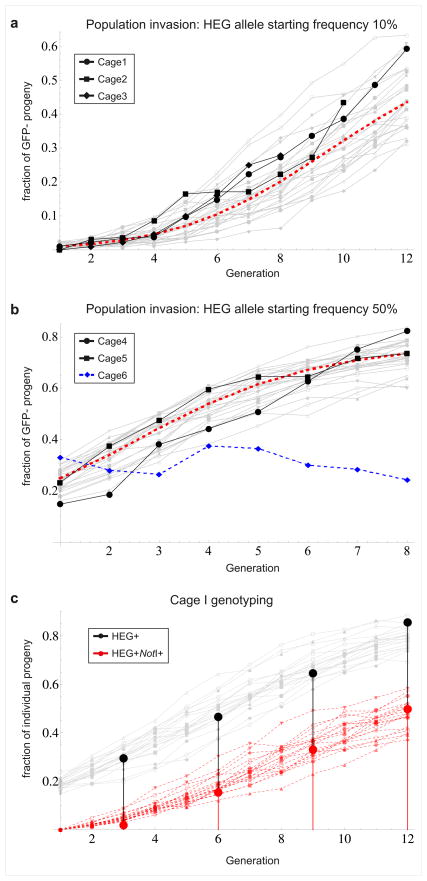
Figure 2. HEG invasion in mosquito cage populations.
a, b Temporal dynamics of GFP− mosquitoes in populations in which the HEG Donor allele was seeded at a frequency of 10% (a) or 50% (b) into a background of GFP+ mosquitoes carrying the HEG Target allele. The experimental points (Black) are overlaid onto predicted dynamics derived from a deterministic population genetic model (Dashed Red Line) and from 20 iterations of a stochastic model (Grey Lines). The dynamics of a cage population in which the HEG Donor and Control alleles were combined at a frequency of 50% is also shown (Dashed Blue Line). c, Molecular genotyping performed on individuals randomly collected from cage 1 at generations 3,6,9 and 12 using a set of PCR primers that specifically amplifies the HEG cassette (Primerset 1b, Supplementary Fig. 2). Presence of the NotI marker was determined by in vitro digestion of PCR products using NotI. The graph shows the fraction of mosquitoes carrying the HEG (Black) and the fraction carrying the HEG and the NotI marker on the same chromosome (Red) overlaid onto predictions from 20 stochastic simulations (Grey lines and Dashed Red Lines, respectively).

