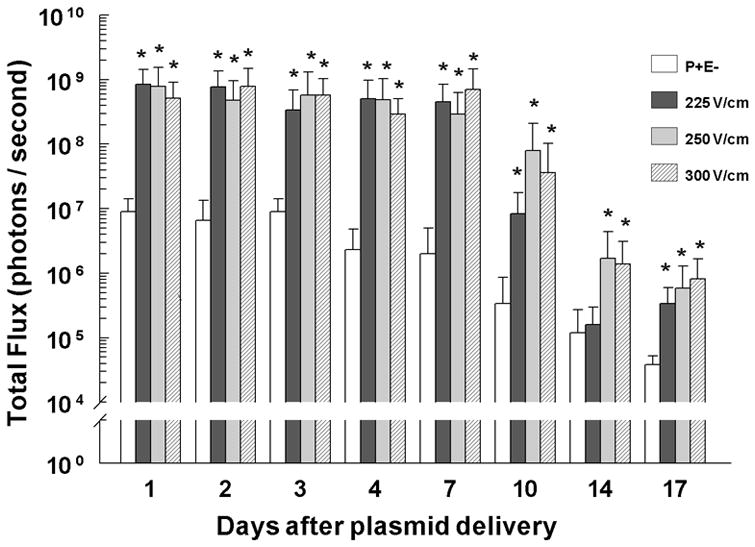
Figure 2. Luciferase expression kinetics.

Luciferase expression was determined at the indicated time points using an in vivo assay for the indicated field strengths (V/cm) with 150 ms pulse widths. pLucE− and 225 V/cm, n=16 per group per time point; 250 V/cm, n=15 per group per time point; 300 V/cm, n=14 per group per time point. *p< 0.001 compared to pLucE− for that time point.
