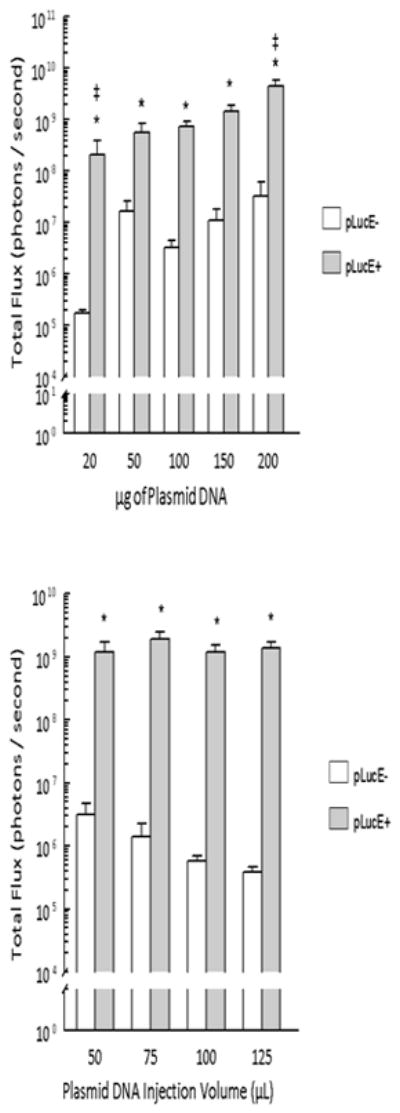
Figure 3. Control of luciferase expression by plasmid dose.

Luciferase expression was determined 48 hours after pLuc delivery using an in vivo assay. pLucE+ = 250 V/cm 150 ms.
Top panel. For 20 μg, 150 μg and 200 μg, n=6 per group for both pLucE− and pLucE+; 100 μg, n=8 per group for both pLucE− and pLucE+; 50 μg pLucE−, n=6; 50 μg pLucE+, n=5. *p< 0.05 for that plasmid dose, ‡ p< 0.05 compared to expression with pLucE+ delivering 100 μg. Bottom panel. Luciferase expression was determined for 100 μg pLuc in the indicated injection volume. n=8 per group. *p< 0.001 compared to pLucE− for that injection volume.
