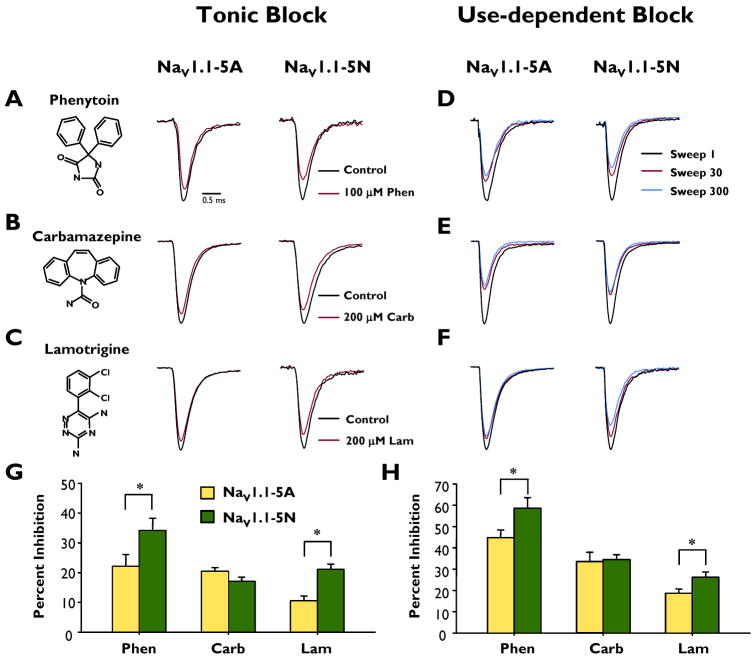
Figure 2.
Tonic block and use-dependent block of peak sodium current by phenytoin, carbamazepine and lamotrigine. Representative whole-cell recordings during superfusion with control (drug free, black trace) or drug (red trace) solutions: (A) phenytoin, (B) carbamazepine or (C) lamotrigine. Representative whole cell recordings showing the 1st (black trace), 30th (red trace) and 300th (blue) pulse illustrating use-dependent inhibition during superfusion of (D) phenytoin, (E) carbamazepine or (F) lamotrigine. Currents are normalized to peak current recorded in control solution. Average tonic block (G) and use-dependent block (H) of peak current of NaV1.1-5A (closed bars) and NaV1.1-5N (open bars) by phenytoin, carbamazepine and lamotrigine. An asterisk indicates p < 0.05. All points represent mean ± SEM for 9 - 14 experiments.

