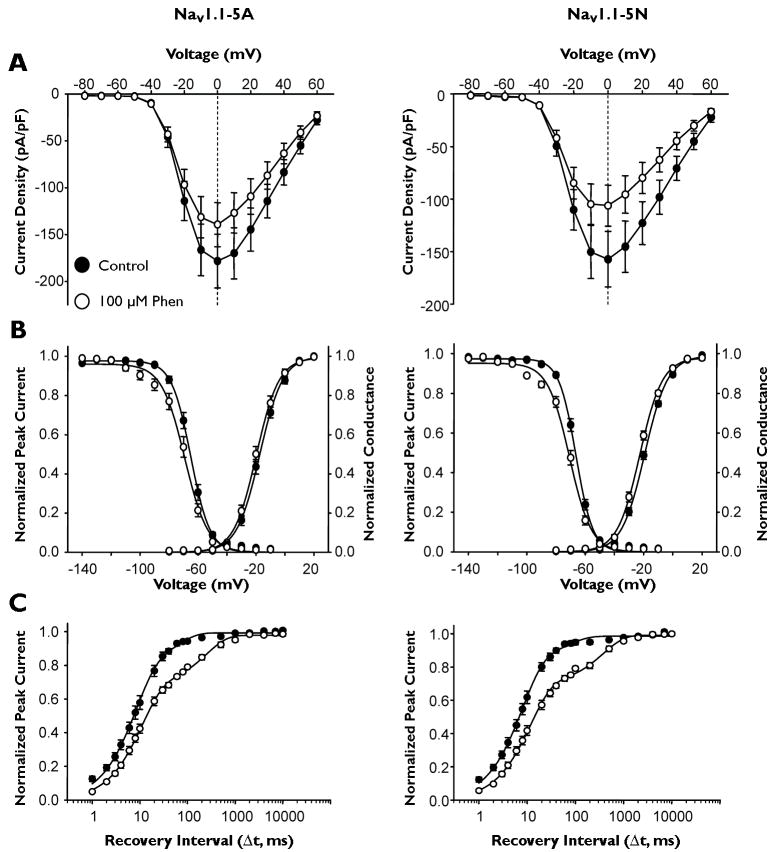
Figure 4.
Effect of phenytoin on NaV1.1 splice variant biophysical properties. (A) Peak current density elicited by test pulses to various membrane potentials and normalized to cell capacitance. (B) Voltage dependence of channel activation measured between −80 to +20mV and voltage dependence of inactivation measured following a 100 ms inactivating prepulse to between −140 and −10 mV. (C) Time-dependent recovery from inactivation assessed with a 100 ms inactivating prepulse to −10 mV. All recordings were performed with a holding potential of −90 mV. Closed symbols represent currents recorded under control condition and open symbols currents in the presence of 100 μM phenytoin. All points represent mean ± SEM for 9 - 10 experiments.

