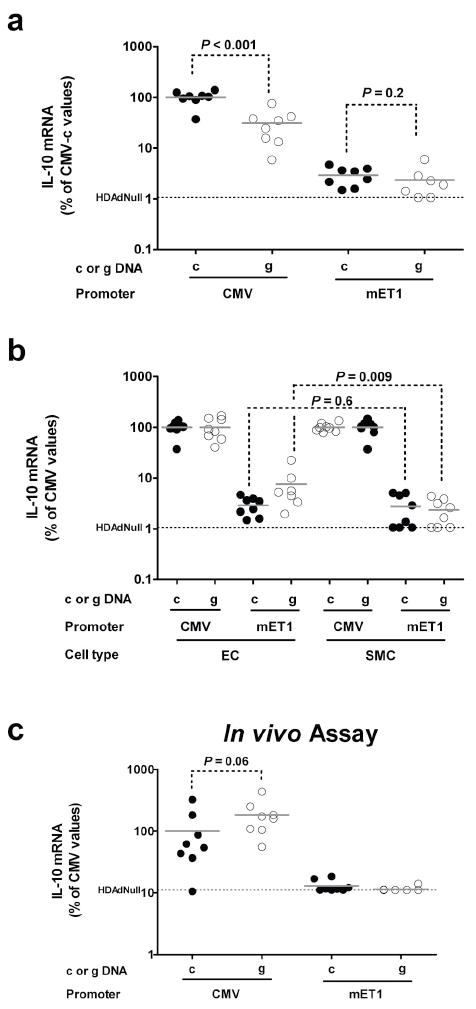
Figure 2.

Expression of IL-10 cDNA (“c”) or genomic DNA (“g”) from the CMV promoter or the mET-1 enhancer-promoter in vitro and in vivo. (a) Bovine aortic endothelial cells (EC) were transduced with each of the 4 vectors, mRNA harvested after 24 hr, and IL-10 mRNA measured by qRT-PCR with mean expression from CMV-cIL-10 assigned a value of 100%. (b) EC or bovine aortic smooth muscle cells (SMC) were transduced, mRNA harvested after 24 hr, and IL-10 mRNA measured by qRT-PCR. For each cell type, mean IL-10 expression in each of the 2 CMV-containing-vector-transduced groups was assigned a value of 100%. Expression in individual wells transduced with this CMV-containing vector or with the analogous mET-1-containing vector is calculated as a percentage of this value. The EC data in (b) are the same data as in (a), replotted after making these calculations. Data points in (a) and (b) are individual wells. (c) In vivo IL-10 expression. RNA was harvested from carotid arteries 3 d after transduction and IL-10 mRNA was measured by qRT-PCR. Mean IL-10 expression in the CMV-cIL-10 group was assigned a value of 100%. Expression in each artery is plotted as a percentage of this value. The background IL-10 qRT-PCR signal [measured in cells (a-b) or in arteries (c) transduced with HDAdNull] is indicated. Bars in all panels are group means.
