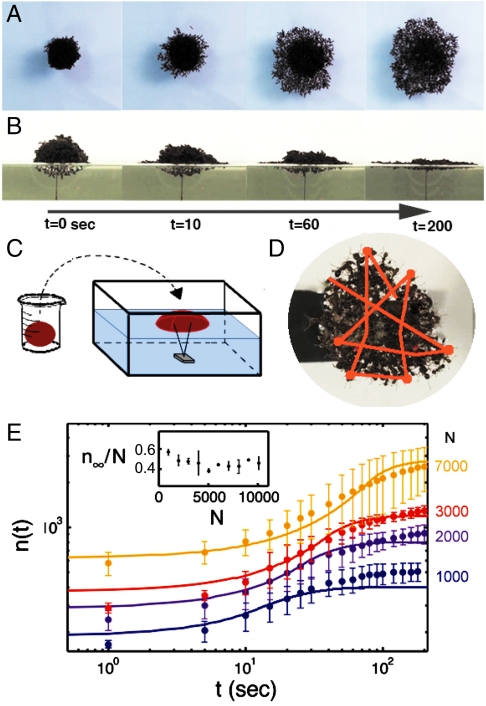
Fig. 3.
Dynamics of ant-raft construction. (A and B) Top and side views of growth of a 3,000-ant raft. (C) Schematic of experimental setup. Ants are rolled into balls in a beaker and then placed onto a pronged stabilizer in a partially filled aquarium. (D) The trajectory of a single ant on the raft, tracked over a duration of 40 s. (E) The relation between time t and the number of ants on the bottom of the raft n(t). Data are shown for four raft sizes, characterized by the number of ants in the raft N. Solid lines are given by the predictions of our theoretical model. (Inset) The relation between the number of ants in the raft N and the proportion of ants on the bottom at equilibrium n∞/N.

