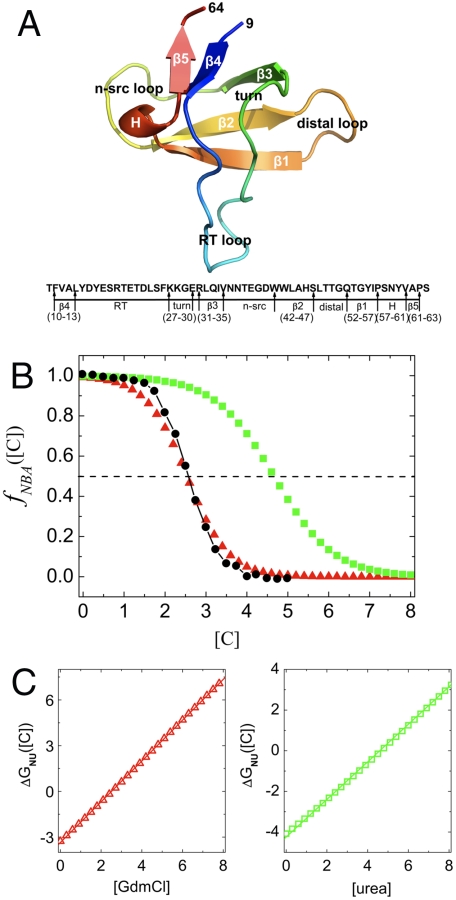
Fig. 1.
Thermodynamics of folding. (A) Cartoon representation of src SH3 [Protein Data Bank (PDB) code 1SRL]. Sequence and the corresponding location of secondary structures are given below. The numbering starts at position 9. In ref. 34 there is an additional aspartic acid residue at the C terminal. In addition, the sequence in ref. 34 has arginine at the 52nd position whereas our sequence has glutamine. (B) Fraction of molecules in the native state as a function of denaturant concentration. The folded-unfolded transition region is assessed using full width at half-maximum of  , which in experiments and simulations for GdmCl is 1.42 M and 1.71 M respectively. Red (green) are the simulation results for GdmCl (urea) and the black dots are experimental results. (C) The dependence of ΔGNU([C]) on [C] for GdmCl (Left) and urea (Right). In (B) and (C) the denaturant concentration is in molarity.

