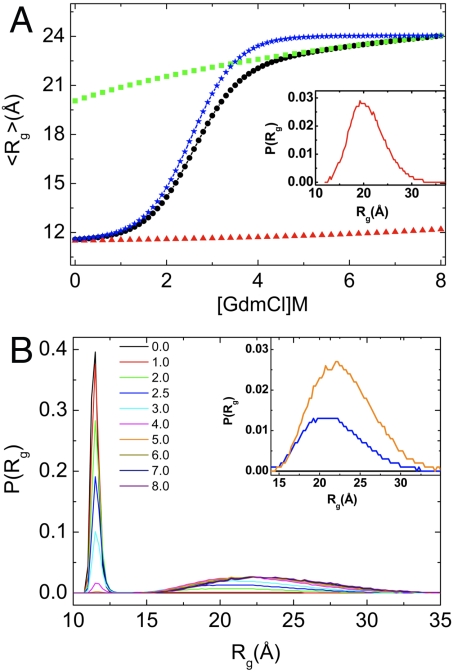
Fig. 2.
Equilibrium collapse. (A) Average 〈Rg〉 (black circles) as a function of GdmCl concentration. Red and green corresponds to 〈Rg〉 for folded and unfoled structures, respectively. Blue symbol is constructed using  ,
,  at [C] = 8.0 M, and fNBA([C]) (see text for details). The Inset shows P(Rg) at [C] = 1.0 M for DSE. (B) Distribution P(Rg) of radius of gyration Rg for various concentrations of GdmCl. The Inset shows P(Rg) for [C] = 0 M (black), [C] = 2.5 M (navy), and [C] = 5.0 M (orange) corresponding to the extended conformations (Rg > 15 Å).

