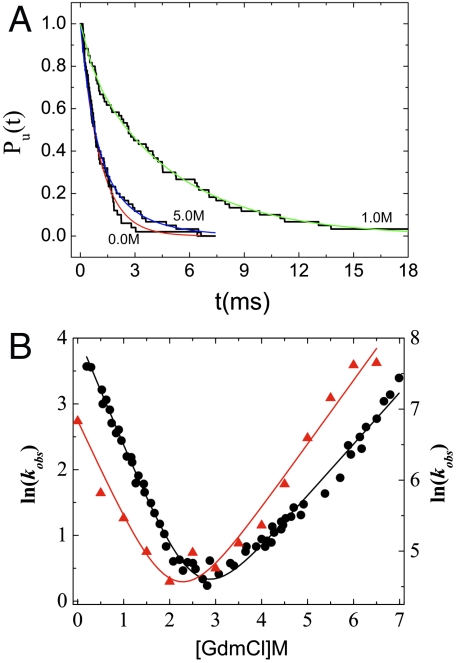
Fig. 3.
Folding kinetics. (A) Fraction of molecules that have not folded ([C] = 0.0 M, and [C] = 1.0 M) or unfolded ([C] = 5.0 M) as a function of time. The lines are exponential fits to the data. (B) Comparison of chevron plots obtained from simulations and experiment. The scale for the experimental plot for  is on the left, and for the simulations is on the right. The slopes of the calculated folding (mf) and unfolding (mu) are 0.95 kcal/mol·M and 0.60 kcal/mol·M, respectively, which are in good agreement with experiment.

