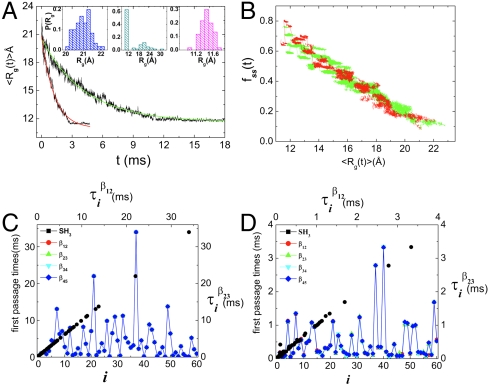
Fig. 4.
Folding and unfolding pathways. (A) Collapse kinetics monitored by the time-dependent average 〈Rg(t)〉 as a function of t. Collapse (expansion) decreases (increases) in 〈Rg(t)〉 can be fit using a single exponential function. The Inset shows P(Rg; t) at t = 0, t ≈ τc ≈ (kc([C] = 1.0 M))-1 ≈ 4.2 ms, and t = 34 ms, the first passage time for the slowest trajectory, respectively. (B) Projection of kinetic folding trajectories in terms of fraction of secondary structure formation, fss, and 〈Rg〉. (C) First passage time for formation of various interactions, indicated in the figure, from the sixty folding trajectories at [C] = 1.0 M. The solid black symbols show the correlation between  and
and  , which are first passage times for formation of interactions β1 - β2 and β2 - β3, respectively. (D) Same as (C) except the results are for unfolding at [C] = 6.0 M. Similarity between (C) and (D) establishes the reversibility between folding and unfolding.

