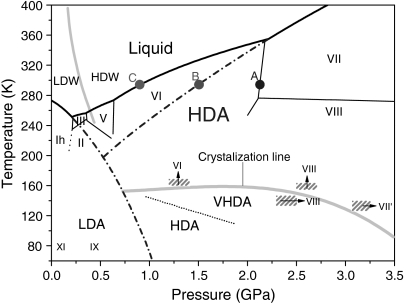
Fig. 1.
The phase diagram of H2O. The dashed-dotted curves are the extrapolated melting lines of ice Ih and ice VII to compare the pressure-induced amorphorization. The gray lines signify the proposed phase boundary of LDW and HDW (10) and the suggested crystallization line of amorphous ices (4, 6, 11). The HDA and VHDA phase boundary was reproduced from ref. 11. The hatch areas with arrows signify the crystallization of high density amorphous ice to various crystalline phases, reproduced from refs. 6 and 15.

