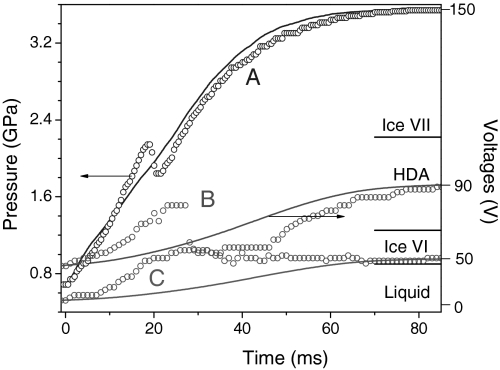
Fig. 2.
The measured pressures of three typical experiments to the stability zones of ice VI (C), metastable ice VII where HDA forms (B), and ice VII (A), plotted together with the trapezoidal piezo-input signals. The labels on the right signify the pressure range observed the corresponding ice phases.

