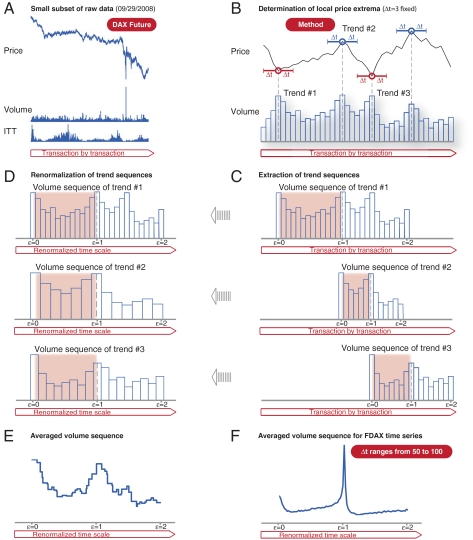
Fig. 1.
Segregation and rescaling of trend sequences in a multivariate time series in order to analyze financial market quantities on the path from one price extremum to the next. (A) Small subset comprising 121,400 transactions of the full dataset (13,991,275 transactions) analyzed, extracted from the German DAX future (FDAX) time series which provides transaction prices, transaction volumes, and time intervals between transaction—intertransaction times (ITT). This subset recorded on September 29, 2008 documents the volatile reaction of stock markets as the US government’s $700 billion financial bailout plan was rejected by the House of Representatives on that day. (B) Schematic visualization of trend segregation for Δt = 3. Positive trends start at local price minima (red circles) and end at local maxima (blue circle)—and vice versa. A transaction price p(t) is a local maximum if there is no higher transaction price in the interval t - Δt ≤ t ≤ t + Δ. Analogously, p(t) is a local minimum if there is no lower transaction price in the interval t - Δt ≤ t ≤ t + Δ. (C) Segregated sequences of transaction volumes belonging to the three trends identified in (B). We assign ε = 0 to the start of each trend, and ε = 1 to the end of each trend. In order to study trend switching processes—both before as well as after the end of a trend—we consider additionally the subsequent volume sequences of identical length. (D) Visualization of the volume sequences in the renormalized time scale. The renormalization assures that trends of various lengths can be aggregated as all switching points have a common position in this renormalized scale. (E) Averaged volume sequence derived from the summation of the three trend sequences. (F) Average volume sequence v∗(ε) for all trends in the full FDAX time series derived from summation over various values of Δt. Extreme values of the price coincide with peaks in the time series of the volumes.

