
Fig. 2.

Renormalization time analysis and log–log plots of quantities with scale-free properties. (A) Averaged volume sequence v∗(ε) of the German DAX Future time series. Δt ranges from 50 to 100 transactions (ticks). Extreme values of the price coincide with sharp peaks in the volume time series. (B) A very similar behavior is obtained for the averaged volume sequence v∗(ε) of S&P500 stocks. Here, Δt ranges from 10 days to 100 days. (C) Averaged intertrade time sequence τ∗(ε) of the German DAX Future time series. Extreme values of the price time series are reached with a significant decay of intertrade times (50 ticks ≤ Δt ≤ 100 ticks). Averaged volume and averaged intertrade time sequences are asymmetric for two main reasons: Only ε = 0 and ε = 1 correspond to extreme values in the price time series. In order to study the behavior before and after a trend switching point, we extend individual sequences from ε = 0 to ε = 1 by an identical amount of transactions or intertrade times. In addition, the end of a trend, ε = 1, does not necessarily correspond to the starting point of the next trend due to filter criteria mentioned in the main text. (D) Log—log plot of the FDAX transaction volumes (50 ticks ≤ Δt ≤ 1,000 ticks) before reaching an extreme price value (ε < 1, circles) and after reaching an extreme price value (ε > 1, triangles). The straight lines correspond to power-law scaling with exponents 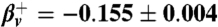 (t-test, p-value = 9.2 × 10⁻¹⁶) and
 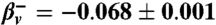 (t-test, p-value < 2 × 10-16). The shaded intervals mark the region in which the empirical data are consistent with a power-law behavior. The left border of the shaded regions is given by the first measuring point closest to the switching point. The right borders stem from statistical tests of the power-law hypothesis (see SI Appendix). (E) Log—log plot of the transaction volumes shown in (B) indicates a power-law behavior with exponents
 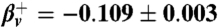 (t-test, p-value < 2 × 10-16) and
 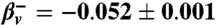 (t-test, p-value = 1.7 × 10⁻⁹) which are similar to our results on short time scales. (F) Log—log plot of the intertrade times on short time scales (50 ticks ≤ Δt ≤ 100 ticks) exhibits a power-law behavior with exponents
 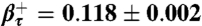 (t-test, p-value < 2 × 10-16) and
 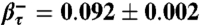 (t-test, p-value = 1.8 × 10⁻¹⁵). An equivalent analysis on long time scales is not possible as daily closing prices are recorded with equidistant time steps.