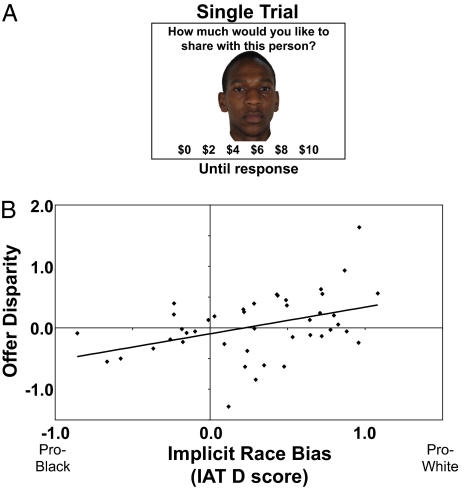
Fig. 2.
Study 2: Individual differences in implicit race attitude correlate with race disparity in economic decisions. (A) Diagram of a single modified Trust Game trial. The stimuli were the same as in study 1. (B) Scatter plot showing each individual's score on the black/white, pleasant/unpleasant IAT and their black/white disparity in offers [Pearson's r(41) = 0.4072; P = 0.0067]. Offer Disparity = Mean(white offer z score) − Mean(black offer z score).

