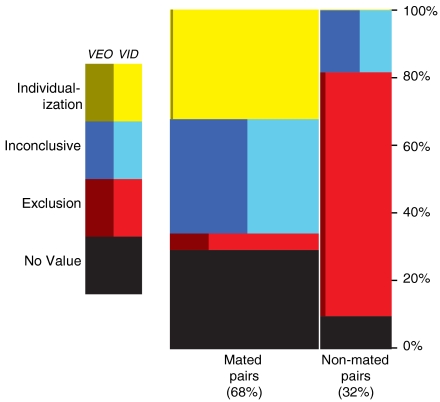
Fig. 2.
Distribution of 17,121 decisions. 23% of all decisions resulted in no-value decisions (no comparison was performed); comparison decisions were based on latents of VID and of VEO; 7.5% of comparisons of mated pairs resulted in exclusion decisions (false negatives); 0.1% of comparisons of nonmated pairs resulted in individualization decisions (false positives—too few to be visible) (SI Appendix, Table S5).

