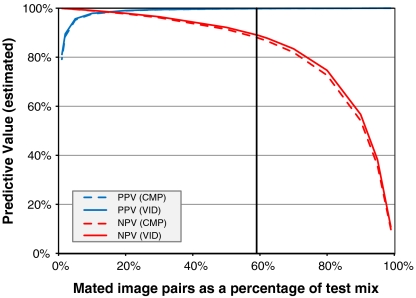
Fig. 4.
PPV and NPV as a function of mate prevalence in workload. The observed predictive values (PPVVID,59% = 99.8% and NPVVID,59% = 88.9% for VID comparisons) correspond to the actual test mix (indicated) where 59% of VID comparisons were mated pairs; other predictive values are calculated as a function of mate prevalence. Sixty-two percent of all comparisons (VEO and VID) were performed on mated pairs, and PPVCMP,62% = 99.8% and NPVCMP,62% = 86.6%.

