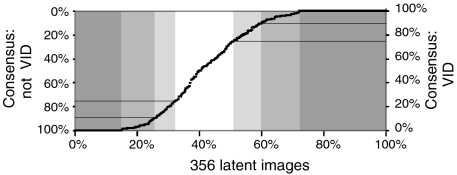
Fig. 6.
Examiner consensus on VID decisions, showing the percentage of examiners reaching consensus (y axis) on each latent (x axis). Areas of unanimous (100%), decile (10%, 90%), and quartile (25%, 75%) consensus are marked. For example, at a 90% level of consensus (y axes), examiners agreed that 40% of the latents were VID (interval from 60% to 100% indicated by a horizontal line in upper right) (SI Appendix, Table S11). Such measures of consensus may be useful in developing quantity and quality metrics.

