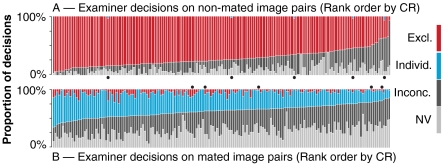
Fig. 7.
Decision rates by examiner. Proportions of decisions for all 169 examiners on (A) nonmated and (B) mated image pairs. Examiners in each chart are sorted on CR. Each examiner was randomly assigned 51 to 74 mated image pairs (mean 69, SD 5) and 26 to 53 nonmated image pairs (mean 33, SD 7). In both, errors are shown in red. Column width indicates the number of image pairs. Examiners who made false positive errors are indicated with black dots (SI Appendix, Table S7).

