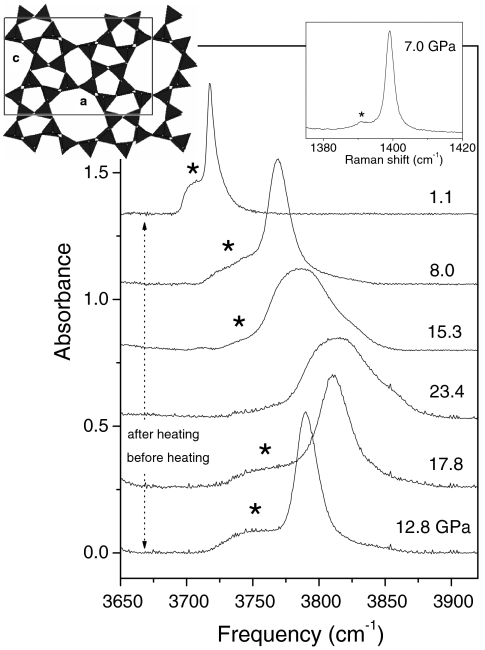
Fig. 1.
IR and Raman (Right Inset) spectra of mixed silicalite and CO2, showing evidence of the chemical reaction. The main figure shows IR spectra in the frequency region of the (ν3 + ν1; ν3 + 2ν2) combination band of CO2. (Right Inset) Raman spectrum in the frequency region of the ν+ line of CO2, measured before the heating. Asterisks indicate peaks of CO2 confined in the micropores of silicalite. The stronger peaks are from bulk, free CO2 (see text). The sample was heated to 600 K for about 1 h. IR spectra before (after) the heating were measured upon increasing (decreasing) pressure. Changes in the line-shape of the band of bulk CO2 are related to phase transitions among phases I, II, III, and IV of molecular CO2 (1, 18). (Left Inset) Schematic representation of the crystal structure of silicalite.

