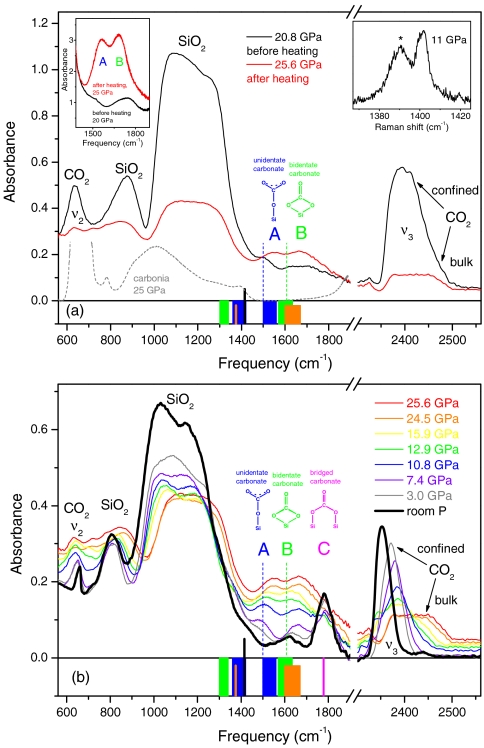
Fig. 2.
IR spectra of mixed silicalite and CO2 (thin sample, approximately 1 μm), showing the formation of silicon carbonate. The compound is identified by the A, B, and C peaks, assigned to unidentate, bidentate, and bridged silicon carbonate species, respectively. (Upper) IR spectra before and after the heating to 740 K. Heating lasted for about 1 h. Gray dashed line indicates spectrum of carbonia (13). The peak at 2,400 cm-1 and the high-frequency shoulder at 2,450 cm-1 are assigned to the ν3 mode of confined and bulk CO2, respectively. After heating, the confined CO2 has almost vanished, and the ν3 peak is dominated by the component of bulk CO2, which did not react. (Left Inset) IR spectra of a thick (20 μm) sample, before and after temperature annealing, showing the formation of the strong A and B peaks. (Right Inset) Raman spectrum of the ν+ line of CO2 on the 1-μm-thick sample, before annealing. Peaks of confined (asterisk) and bulk CO2 have an integrated intensity ratio of about 3. (Lower) IR spectra measured upon decreasing pressure, after annealing. The behavior of the ν3 peak shows that confined CO2 forms again (sharp component), starting at about 16 GPa; instead, bulk CO2 (broad component) vanishes, indicating that this material progressively extrudes from the sample chamber. Vertical black sticks (Upper and Lower) indicate frequency of the IR stretching mode of the free CO3 ion (24). Blue, green, and orange bars (Upper and Lower) indicate spectral ranges, at ambient pressure, of the split high- and low-frequency components of the IR stretching mode of the free CO3 ion, as found in unidentate (blue), bidentate (green), and bridging, T-CO3-T (orange) carbonates, obtained from CO2 adsorption on metal oxides and dissolution in silicate melts (see text). The two components correspond to the antisymmetric and the symmetric C─O stretching modes, respectively, involving the two equivalent oxygen atoms. Pink bar (Lower) indicates spectral range, at ambient pressure, for the highest-frequency IR stretching mode of bridging carbonates also obtained from adsorption of CO2 on some metal oxides (see text). Vertical, dashed lines (Upper and Lower) indicate room pressure extrapolated frequencies of the A and B peaks.

