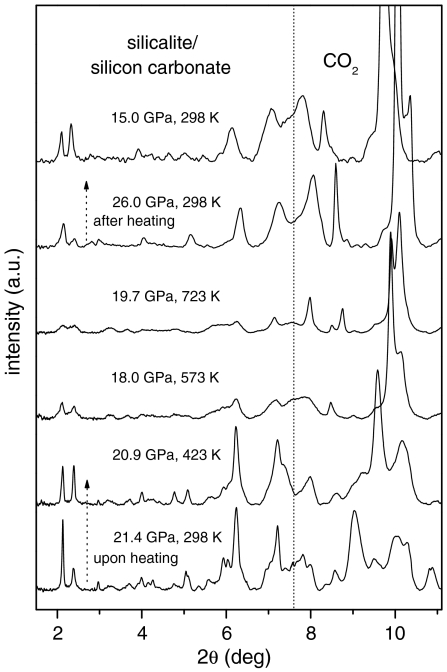
Fig. 3.
High P-T, XRD patterns of silicalite-CO2 mixture, showing the formation of a highly strained, disordered crystal. From the bottom to the top: The sample was heated to 723 K at 18–26 GPa, for about 1 h. The temperature-quenched material was then decompressed to 15 GPa. The sample thickness is about 20 μm, as in Fig. 1. At angles higher than the vertical dotted line the diffraction pattern is dominated by the peaks of bulk, molecular CO2, which undergoes phase transitions between phases I, II, III, and IV. The intensity of the patterns has been normalized to the same acquisition time and X-ray beam intensity.

