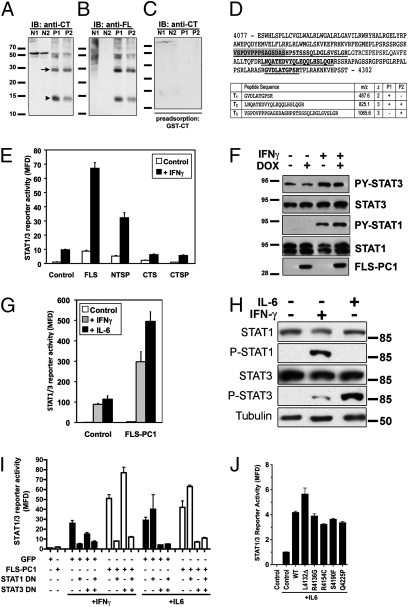
Fig. 3.
The cleaved cytoplasmic tail of PC1: Expression in ADPKD and STAT coactivation. (A and B) Immunoblots of total lysates from normal (N1 and N2) and ADPKD (P1 and P2) renal tissues probed with anti-CT antibody (against the C-terminal half of the human PC1 tail) or anti-FL antibody (against the entire human PC1 tail) as indicated. (C) Specificity control: anti-CT antibody preadsorbed with antigen. (D) Mass spectrometric analysis of the ∼15-kDa band from ADPKD patients. The identified peptides detected are underlined in bold in the human PC1 tail sequence. For orientation, the PEST domain is highlighted in gray. (E) STAT1/3 luciferase assay in HEK293T cells transfected with control GFP or soluble PC1 constructs and treated with IFNγ (20 ng/mL) as indicated. (F) FLS-PC1 expression was induced with DOX for 16 h in stably transfected MDCK cells followed by a 30-min treatment with IFNγ where indicated. (G) STAT1/3 luciferase assay with expression of FLS-PC1 and treatment with IFNγ or IL6 as indicated. (H) HEK293T cells were treated with IFNγ or IL6 as indicated for 30 min before lysis and probed with the indicated antibodies. (I) STAT1/3 luciferase assay in the presence of DN-STAT1 and DN-STAT3 and FLS-PC1 as indicated. IFNγ or IL6 treatment for activation of STAT1 and STAT3, respectively. (J) Pathogenic mutants in the FLS-PC1 context do not affect STAT3 coactivation after IL6 stimulation in STAT1/3 luciferase assay.

