
Figure 4.
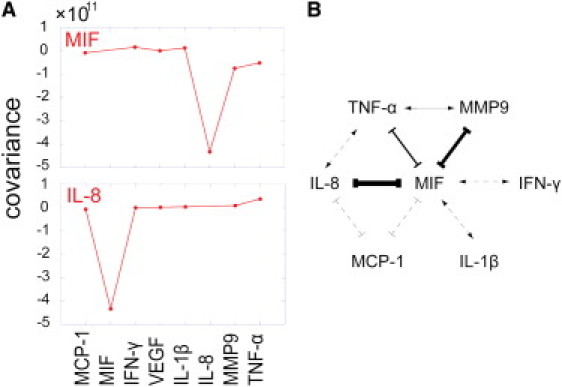
Summary network derived from the information theory treatment of the data. (A) Shown are the columns for the two most connected proteins, MIF and IL-8. The entries are the covariances of the indicated protein with the other proteins listed in the abscissa. Self-correlations are not shown. It is these interdependencies, as revealed by the columns of the covariance matrix, that provide the prediction of the connectivity in the network. (B) The protein correlation network hypothesis. The thickness of a connector is an indication of correlation strength. Arrows indicate a positive correlation; bars indicate inhibition.