
Figure 3.
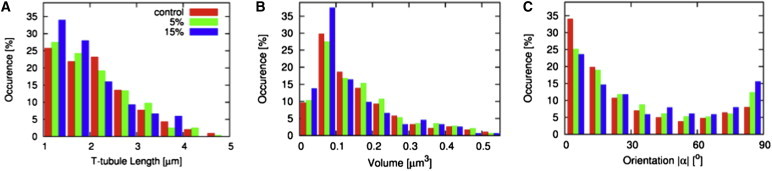
Statistical analysis. Histograms of (A) t-tubule length, (B) volume, and (C) orientation of cross sections are presented for control cells and cells at 5% and 15% strain. Strain was associated with an increase of short t-tubules and small volume. Cross sections of t-tubules of strained cells tended toward having minor axes perpendicular to the myocyte long axis.