
Figure 2.
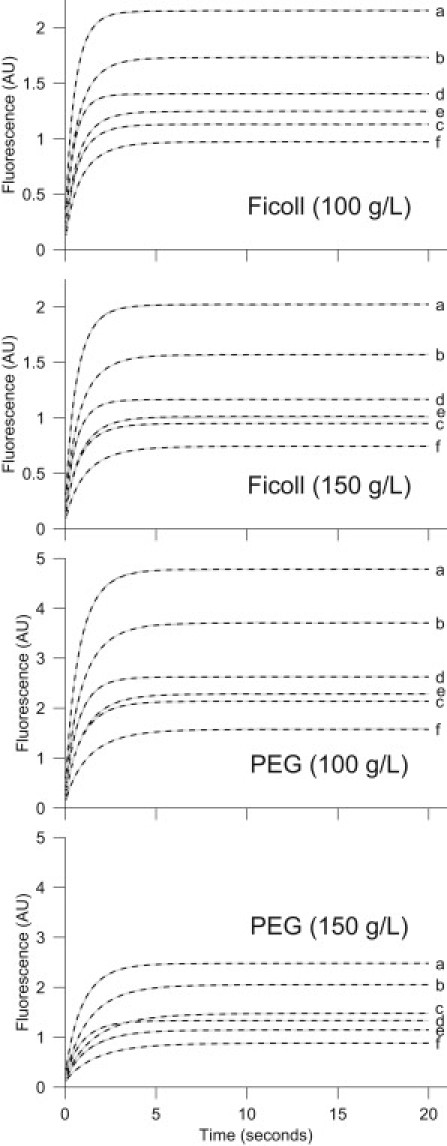
Reaction progress curves of the complex formation of CA and DNSA measured for six combinations of initial μM concentrations ([CA],[DNSA]): (a) (10,20), (b) (10,10), (c) (10,5), (d) (5,20), (e) (5,10), and (f) (5,5), in the presence of crowding with PEG and Ficoll. The curves (solid lines) are the means of five repeated measurements. The SDs are small, on the order of the line widths. Dashed lines (gray), which mainly coincide with the solid lines, represent the fit by the svsv model.