
Figure 5.
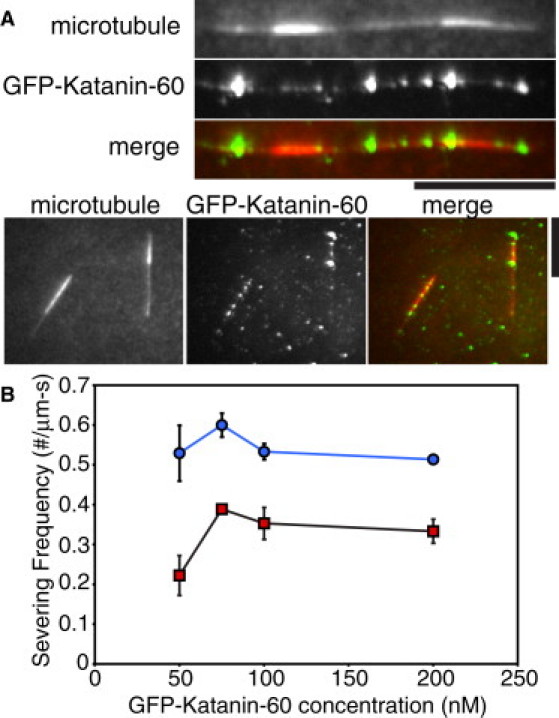
GFP-Katanin-p60 severs at interfaces between GMPCPP and GDP-taxol MT segments. (A) The MT frames depict the MTs as they existed at the beginning of the movie before severing (red in merge). The GFP-Katanin-60 frame is a z-projection of the SD of a time series of GFP-Katanin-60 binding (green in merge). Scale bars, 5 μm. (B) Measurement of frequency of severing at 50 nM (N = 9), 75 nM (N = 18), 100 nM (N = 17), and 200 nM (N = 21) GFP-Katanin-60 at interfaces (blue circles) and 1 μm away from interfaces (red squares). N-values represent the number of MTs analyzed, the points on the plot represent the mean value, and the error bars represent the mean ± SE.