
Figure 6.
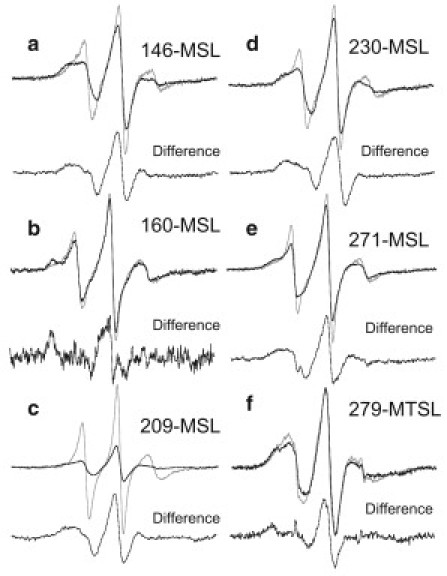
Overlay of spectra from MSL and MTSL of Tm on actin filament with Tn or on actin filament (Tm-Tn-actin7 or Tm-actin7, gray line), plus myosin S1 (Tm-Tn-actin7-S17 or Tm-actin7-S17, dark line). (a) Spectra from MSL at residue 146. The difference spectrum was produced by subtracting 30% of Tm-actin7 spectrum from Tm-actin7-S17. (b) Spectra from MSL at residue 160. The difference spectrum was produced by subtracting 80% of Tm-Tn-actin7 spectrum from Tm-Tn-actin7-S17 spectrum. (c) Spectra from MSL at residue 209. The difference spectrum was produced by subtracting 10% of Tm-actin7 spectrum from Tm-actin7-S17. (d) Spectra from MSL at residue 230. The difference spectrum was produced by subtracting 40% of Tm-actin7 spectrum from Tm-actin7-S17. (e) Spectra from MSL at residue 271. The difference spectrum was produced by subtracting 50% of Tm-Tn-actin7 spectrum from Tm-Tn- actin7-S17 spectrum. (f) Spectra from MTSL at residue 279. The difference spectrum was produced by subtracting 80% of Tm-actin7 spectrum from Tm-actin7-S17.