
Figure 7.
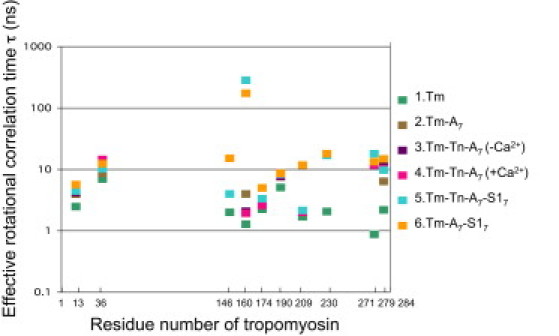
Profile of effective rotational correlation time as a function of the number of MSL-labeled Tm residues. Effective rotational correlation time was estimated from the spectra shown in Fig. 2 and the difference spectra obtained as shown in Figs. 4–6 and indicated by the average value obtained from at least three preparations (see Materials and Methods). When the spectrum consisted of fast and slow components, the major peak (Fig. 2, dark arrow) was used for estimation of effective rotational correlation time. On the right side of upper figure, each color of markers indicates the order of rows and the sample preparation shown in Fig. 2.